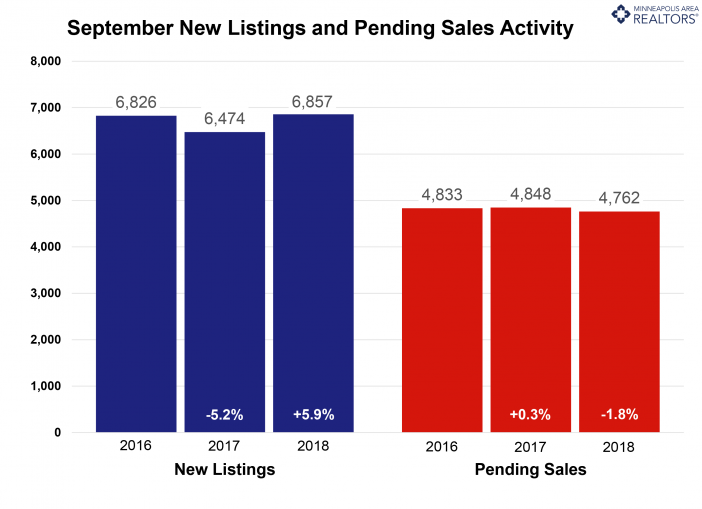
After years of strong buyer activity and weak seller activity, the market tides seem to finally be shifting back toward balance. Strong demand and weak supply have created an environment that favors sellers. But if anything can be called a constant in the market—it’s change. Four of the last five months showed increases in new listings; while four of the last five months also had decreases in pending sales.
While the market hasn’t quite transformed, the dynamics are shifting and the market is transitioning. September saw the smallest decline in active listings since May 2015, and those long-awaited inventory gains could still happen this year. Months supply was down just 3.8 percent to 2.5 months. Today’s buyers still face plenty of competition over limited supply. However, a recent uptick in rates could further impact some budget-conscious buyers. Locking in at current levels would be advantageous in a rising rate environment.
Sellers yielded an average of 98.4 percent of their original list price and 99.7 percent of their current list price, partly illustrating that the shortage still looms. The lack of supply is especially noticeable at the entry-level prices, where multiple offers and homes selling for over list price have become commonplace. The move-up and upper-bracket segments are less competitive and—for the most part—much better supplied. It’s noteworthy that inventory levels could double while sales remain stable and we’d still have less than 5 months of supply.
September 2018 by the Numbers (compared to a year ago)
• Sellers listed 6,857 properties on the market, a 5.9 percent increase
• Buyers closed on 5,087 homes, a 5.8 percent decrease from last September
• Inventory levels for September fell 4.4 percent compared to 2017 to 12,570 units
• Months Supply of Inventory was down 3.8 percent to 2.5 months
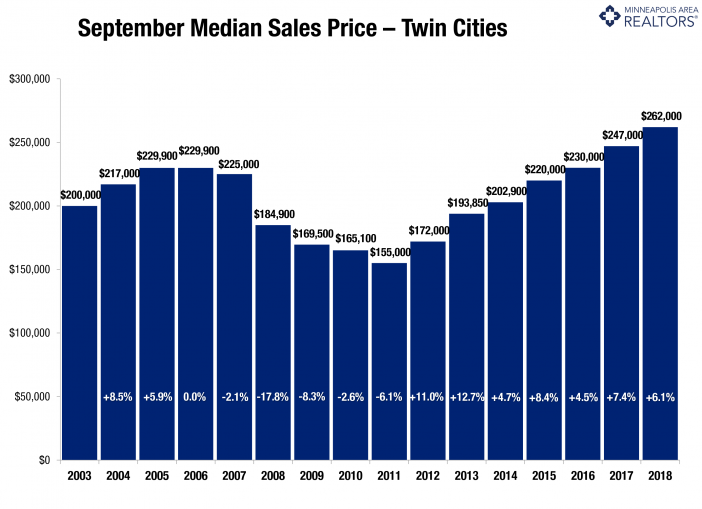
• The Median Sales Price rose 6.1 percent to $262,000, a record high for September
• Cumulative Days on Market declined 16.0 percent to 42 days, on average (median of 24)
• Changes in Sales activity varied by market segment
• Single family sales fell 6.3 percent; condo sales declined 1.1 percent; townhome sales rose 0.4 percent
• Traditional sales fell 4.0 percent; foreclosure sales sank 41.1 percent; short sales dropped 25.0 percent
• Previously-owned sales were down 5.9 percent; new construction sales increased 11.5 percent
Powered by WPeMatico

