Hi there. MAR Research here. David speaking typing. From the office home.
First off – we hear you. You and your clients have questions about how recent events might be impacting the market. And even though we find ourselves meandering the same complex web of rapidly changing information that you are, we are committed to analyzing and sharing the latest trends we see from the data. Particularly in uncertain times, data offers a unique, unbiased and unemotional portal into our world, and all the beauty and ugliness therein.
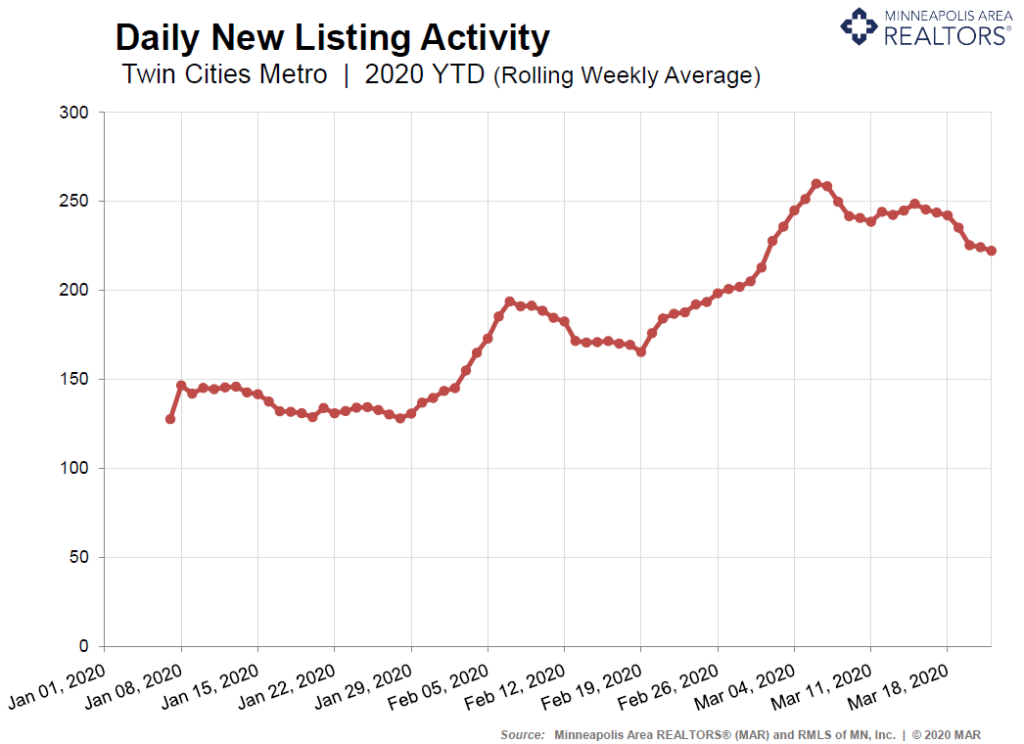
Let’s start with a trendline showing daily new listing activity using a rolling weekly average. Many say that the spring market “kicks off” right after the Super Bowl. Sure enough, seller activity was on an upswing starting January 29th and accelerating on February 3rd the Monday after the big game. Then there was a moderate slowdown in listing activity starting around February 7th. February 19th – March 6th saw another upswing in seller activity, but then on March 7th activity began to decline as media coverage and apprehensions seemed to intensify. After March 7th, seller activity began flattening out again; after March 18th, new listings resumed their decline at a time when we’d expect increasing listing activity.
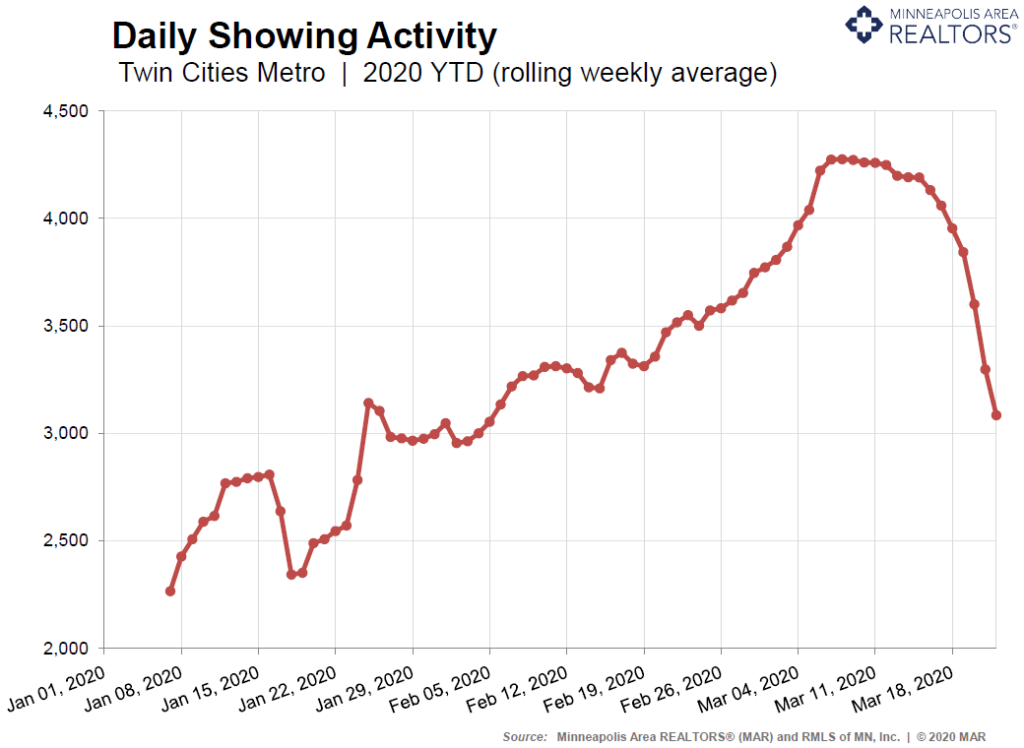
The number of showings has also declined lately, as we can see from the rolling weekly average trend of daily showings below. Despite a quick blip starting around January 17th (a fairly coldish weekend?), showings have been on the rise throughout most of the year. Starting around March 7th, showing activity flattened out quickly and a directional change was evident by March 16th and 17th. That downward trend accelerated—particularly after March 18th—and pushed showing activity down to levels consistent with an early February market, again at a time when we’d expect increasing showing activity. One challenge here is understanding whether sellers are uneasy about all the buyer traffic in their homes or if buyers are wary of going into several different homes due to health concerns. The truth, as usual, is probably somewhere in the middle.
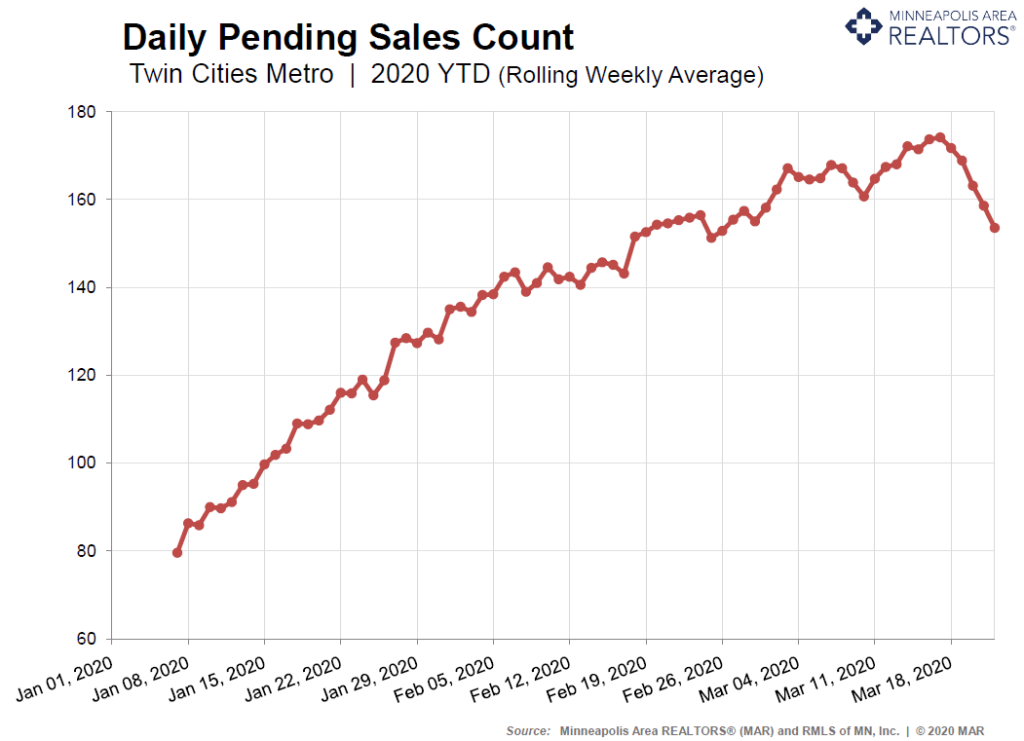
Lastly, it’s important to measure the demand side of the equation with our leading demand indicator: pending sales. A pending sale is a signed contract or accepted purchase agreement on a property. Pending sales haven’t closed yet, but odds are quite good that they will. The first thing to note about purchase demand (below) is that it remained remarkably resilient and on a consistent growth trajectory through all of this—until March 18th (Wednesday). The second thing to note is that the recent decline isn’t nearly as dramatic as showing traffic might suggest. Perhaps a third important takeaway is the fact that not all price ranges behave the same. Pending sales have actually been rising as recently as last week in the affordable brackets (i.e. $250K-350K) while weakening notably in the luxury brackets (especially above $1M). Our March 19th media release showed this dynamic in detail.
There could be a few different reasons for this. First, the buyers in that entry-level demographic tend to be younger first-time buyers, armed with a youthful but misguided sense of immortality (we’ve all been there). They are young, fearless and invincible, or so they think. Virus be damned. Second, buyers in that segment are also very payment- and rate-sensitive. The Federal Reserve has taken bold actions lately aimed at stabilizing financial and capital markets as well as the economy at large. That meant a drop in the 30-year fixed mortgage rate that briefly put it back below 3.5 percent (a level no one thought we’d see again for quite some time). So it’s possible that was a motivating factor for some first-time or second move-up buyers. Third, some buyers may have taken advantage of a less crowded marketplace where they have a better chance of an offer being accepted compared to a more competitive market where strong demand is overwhelming already tight supply levels.
It is our hope this will prove useful to you regardless of your role in the industry. As the trusted voice for local real estate, we are firmly committed to data sharing and transparency with the hopes of better information so that you can make the best decisions and achieve the best outcomes.
These are unique times that call for unique analyses. In addition to our regular suite of weekly, monthly and annual reports, please do check back here for periodic updates as the situation evolves.
Stay well and take care of yourselves and each other.
Also see Star Tribune article: http://www.startribune.com/leave-the-lights-on-agents-tell-sellers-as-virus-reshapes-twin-cities-home-sales/568966762/
The post Measuring the Impact of COVID-19 on Twin Cities Residential Housing Market appeared first on Minneapolis Area Association of Realtors.
Powered by WPeMatico


